摘要
介绍了C++在windows平台上如何调用matplotlib绘制图表,以及vs如何调用Python的工程属性配置、matplotlib-cpp项目几个示例的编译和使用。
matplotlib-cpp项目
一说起开源的绘图程序库就会想到基于Python的matplotlib库,使用简单且绘图功能强大,和matlab一起成为了使用最广泛的绘图库。但是matplotlib时基于Python的,matlab不仅要付费且也是基于自家的脚本运行。最近使用C++写算法时时长要做可视化的分析,之前都是将数据导出来了用Python再可视化,但感觉这样有点麻烦,就网上搜了搜看看C++有没有什么好用的图表库。一番查找下来就发现两个,一是gnu家的gnuplot,二是matplotlib-cpp。一开始看到matplot我有点惊喜,以为matplotlib还有C++版本,后来仔细一看是基于C++调用Python的方法将matplotlib封装了一层。但是也无妨,总比我之前自己尝试用OpenCV的imshow写的辣鸡图表绘制好多了。
matplotlib-cpp项目地址在:https://github.com/lava/matplotlib-cpp,仓库内容很简单,核心的东西就是一个头文件matplotlibcpp.h, 这个头文件封装了大量了的C++调用matplotlib的api,使用的时候只要将matplotlibcpp.h复制到自己的项目中include就可以了。至于怎么使用,作者也给了比较详细的教程和资料,Readme和examples都有详细的使用方法,contrib里面则是介绍windows平台编译example的方法。
编译example
使用CMake编译matplotlib-cpp是比较方便的,作者也非常贴心地给出了CMakeLists.txt,也非常简单假如要编译自己地matplotlib-cpp项目,CMakeLists.txt只需要以下几行配置就可以了
1
2
3
|
find_package(Python2 COMPONENTS Development NumPy)
target_include_directories(myproject PRIVATE ${Python2_INCLUDE_DIRS} ${Python2_NumPy_INCLUDE_DIRS})
target_link_libraries(myproject Python2::Python Python2::NumPy)
|
但以上为linux系统上编译的方法,假如在windows平台编译,则需要复杂一点点,需要设置Python的目录,可以直接参考作者给出的:
 1
 2
 3
 4
 5
 6
 7
 8
 9
10
11
12
13
14
15
16
17
18
19
20
21
22
23
24
25
26
|
cmake_minimum_required(VERSION 3.7)
project (MatplotlibCPP_Test)

set(CMAKE_CXX_STANDARD 11)
set(CMAKE_CXX_STANDARD_REQUIRED ON)

include_directories(${PYTHONHOME}/include)
include_directories(${PYTHONHOME}/Lib/site-packages/numpy/core/include)
link_directories(${PYTHONHOME}/libs)

add_definitions(-DMATPLOTLIBCPP_PYTHON_HEADER=Python.h)

# message(STATUS "*** dump start cmake variables ***")
# get_cmake_property(_variableNames VARIABLES)
# foreach(_variableName ${_variableNames})
#         message(STATUS "${_variableName}=${${_variableName}}")
# endforeach()
# message(STATUS "*** dump end ***")

add_executable(minimal ${CMAKE_CURRENT_SOURCE_DIR}/../examples/minimal.cpp)
add_executable(basic ${CMAKE_CURRENT_SOURCE_DIR}/../examples/basic.cpp)
add_executable(modern ${CMAKE_CURRENT_SOURCE_DIR}/../examples/modern.cpp)
add_executable(animation ${CMAKE_CURRENT_SOURCE_DIR}/../examples/animation.cpp)
add_executable(nonblock ${CMAKE_CURRENT_SOURCE_DIR}/../examples/nonblock.cpp)
add_executable(xkcd ${CMAKE_CURRENT_SOURCE_DIR}/../examples/xkcd.cpp)
add_executable(bar ${CMAKE_CURRENT_SOURCE_DIR}/../examples/bar.cpp)
|
下载matplotlib-cpp项目,有了CMakeLists.txt我们就可以很方便地在windows上编译作者给出的example,在编译之前先确保满足以下条件:
- 已安装CMake
- 已安装VS(需要支持c++17,vs2017以上可以支持)
- 已安装Python并且安装时添加环境变量path(最好从Python官网下载安装,芒果使用anaconda安装的编译不成功,应该和Python的虚拟环境有关)
- Python已安装matplotlib、numpy包
安装步骤:
(1)下载matplotlib-cpp
仓库地址:https://github.com/lava/matplotlib-cpp
(2)设置Python环境变量
编辑matplotlib-cpp/contrib/WinBuild.cmd文件
将第7行
1
|
if NOT DEFINED PYTHONHOME set PYTHONHOME=C:/Users/%username%/Anaconda3
|
的PYTHONHOME路径修改为系统中Python的安装路径,此路径在环境变量可以查看,环境变量中的用户变量path里面。
(3)修改编译c++版本
作者提供的CMakeLists.txt中设置的c++版本为c++11的,在最新的代码中作者采用了新的c++语法特性,采用c++11已经无法编译通过。修改matplotlib-cpp/contrib/CMakeLists.txt:
将第4行:
1
|
set(CMAKE_CXX_STANDARD 11)
|
修改为:
1
|
set(CMAKE_CXX_STANDARD 17)
|
(4)
1
2
|
> cd contrib
> WinBuild.cmd
|
编译过程若发生报错
1
2
3
4
5
6
|
matplotlib-cpp-master\matplotlibcpp.h(304): error C2766: explicit specialization; 'matplotli
bcpp::detail::select_npy_type<int64_t>' has already been defined [C:\Users\haomi\Downloads\matplotlib-cpp-master\exampl
es\build\animation.vcxproj]
matplotlib-cpp-master\matplotlibcpp.h(306): error C2766: explicit specialization; 'matplotli
bcpp::detail::select_npy_type<uint64_t>' has already been defined [C:\Users\haomi\Downloads\matplotlib-cpp-master\examp
les\build\animation.vcxproj]
|
报错提示这两行已经被定义过了,打开matplotlib.h,将其注释掉。
1
2
3
4
|
static_assert(sizeof(long long) == 8);
//template <> struct select_npy_type<long long> { const static NPY_TYPES type = NPY_INT64; };
static_assert(sizeof(unsigned long long) == 8);
// <> struct select_npy_type<unsigned long long> { const static NPY_TYPES type = NPY_UINT64; };
|
重新编译即可。
使用vs直接编译matplotlib
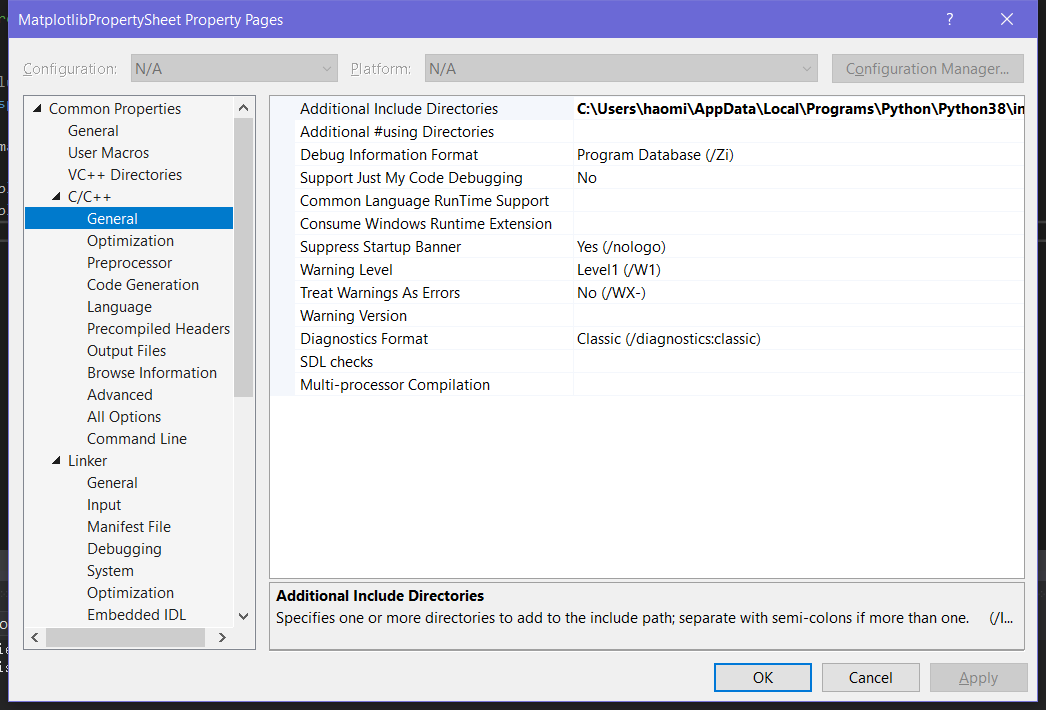
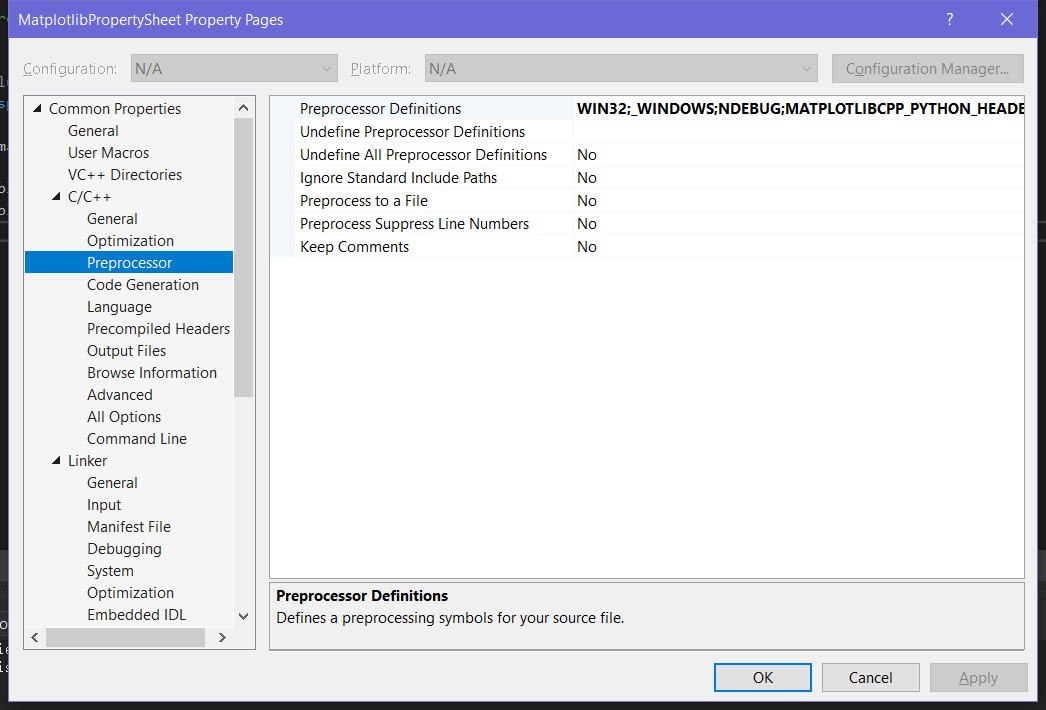
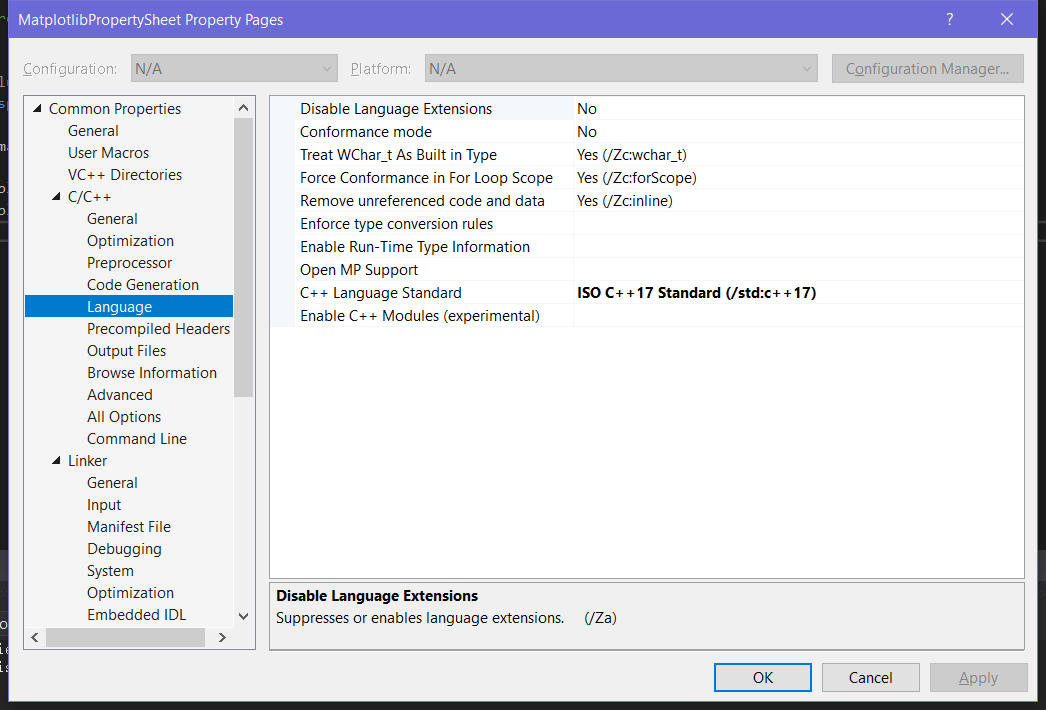
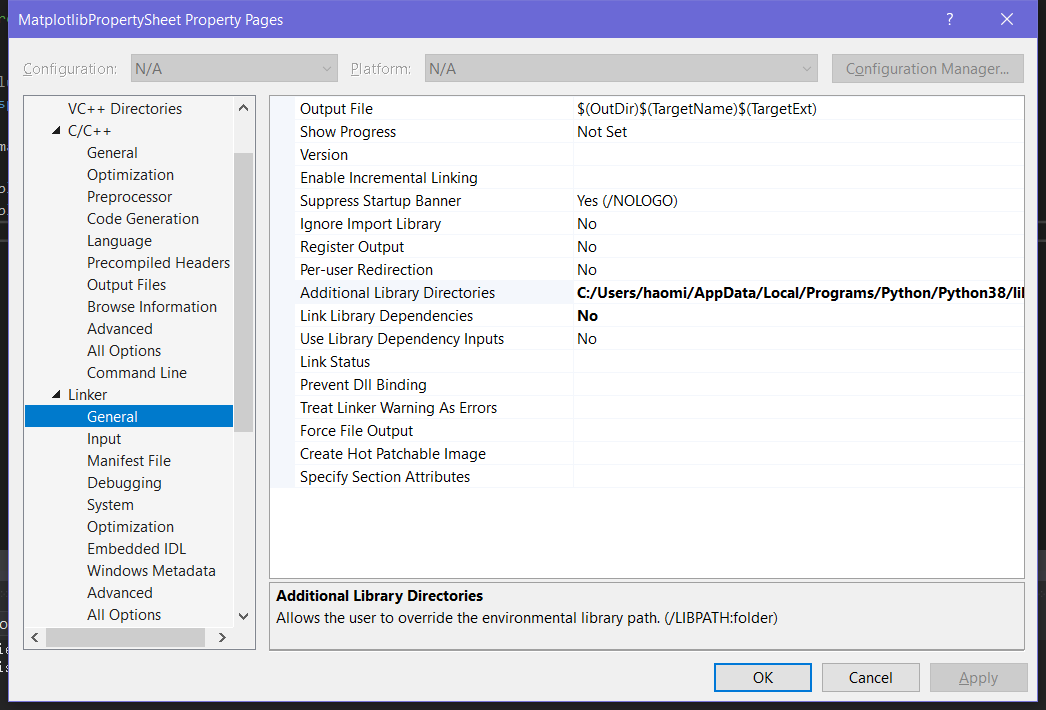
使用vs直接编译的方法也很简单,关键就是属性表的配置部分需要设好,最简单的方式自然是直接照抄CMake编译生成的vs解决方案的,不过里面设置比较多,简答使用的话只需要摘抄关键的几个属性
- 项目必须是Release的,C++调用Python不支持Debug模式
- 附加包含目录(AdditionalIncludeDirectories)
- 预处理器定义:(PreprocessorDefinitions)
- 语言C++标准:设置为C++17
- 附加库目录:(AdditionalLibraryDirectories)
- 链接库依赖:设置位NO
使用matplotlib-cpp
关于如何使用matplotlib-cpp作者也给了很多的例子,这里我就把几个例子搬运过来。
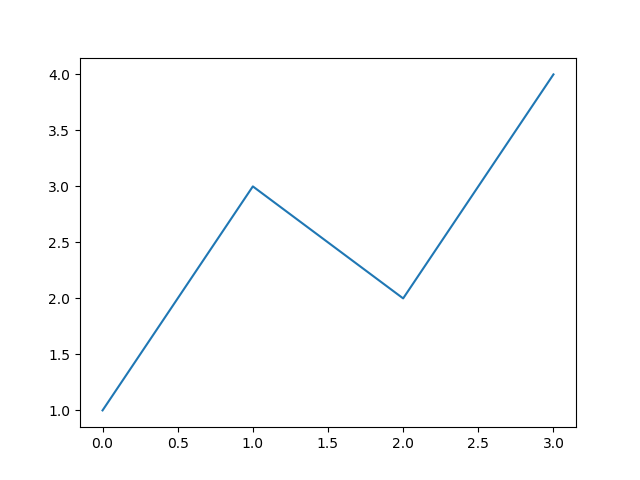
Minimal example:
1
2
3
4
5
6
|
#include "matplotlibcpp.h"
namespace plt = matplotlibcpp;
int main() {
    plt::plot({1,3,2,4});
    plt::show();
}
|
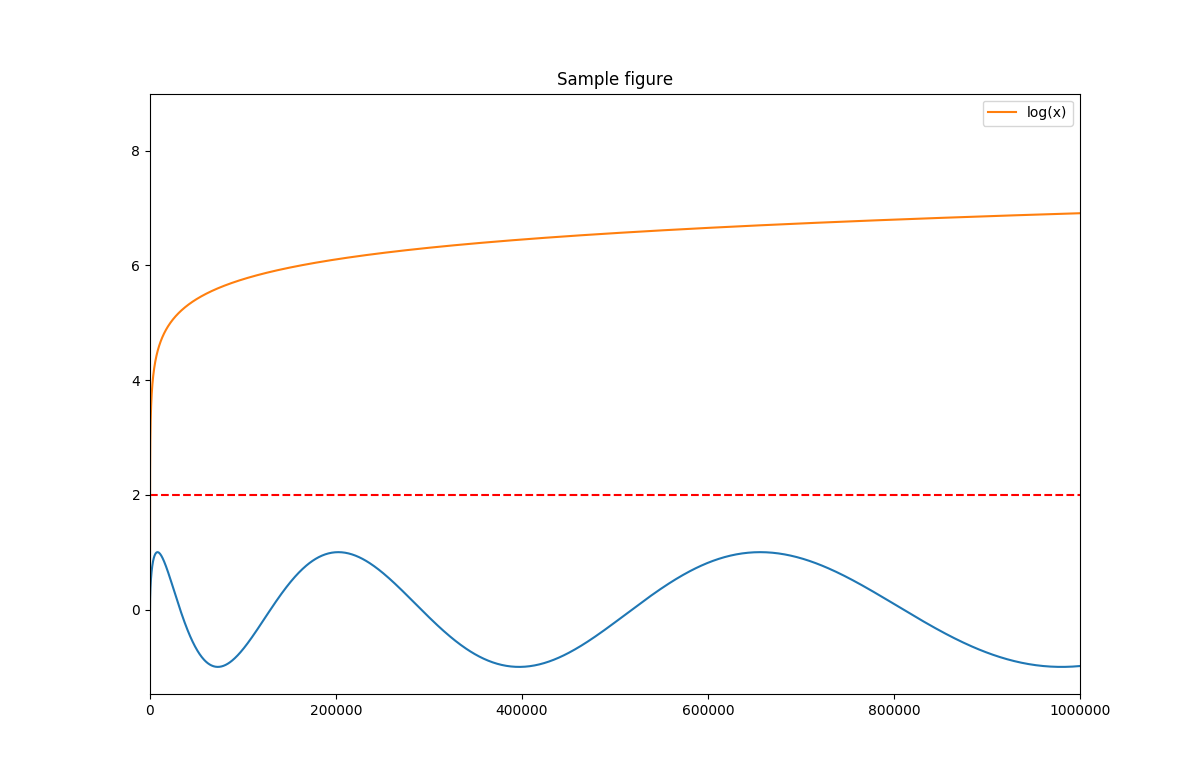
Basic example:
 1
 2
 3
 4
 5
 6
 7
 8
 9
10
11
12
13
14
15
16
17
18
19
20
21
22
23
24
25
26
27
28
29
30
31
32
33
34
35
36
37
38
39
40
41
42
43
44
|
#define _USE_MATH_DEFINES
#include <iostream>
#include <cmath>
#include "../matplotlibcpp.h"

namespace plt = matplotlibcpp;

int main()
{
    // Prepare data.
    int n = 5000;
    std::vector<double> x(n), y(n), z(n), w(n,2);
    for(int i=0; i<n; ++i) {
        x.at(i) = i*i;
        y.at(i) = sin(2*M_PI*i/360.0);
        z.at(i) = log(i);
    }

    // Set the size of output image = 1200x780 pixels
    plt::figure_size(1200, 780);

    // Plot line from given x and y data. Color is selected automatically.
    plt::plot(x, y);

    // Plot a red dashed line from given x and y data.
    plt::plot(x, w,"r--");

    // Plot a line whose name will show up as "log(x)" in the legend.
    plt::named_plot("log(x)", x, z);

    // Set x-axis to interval [0,1000000]
    plt::xlim(0, 1000*1000);

    // Add graph title
    plt::title("Sample figure");

    // Enable legend.
    plt::legend();

    // save figure
    const char* filename = "./basic.png";
    std::cout << "Saving result to " << filename << std::endl;;
    plt::save(filename);
}
|
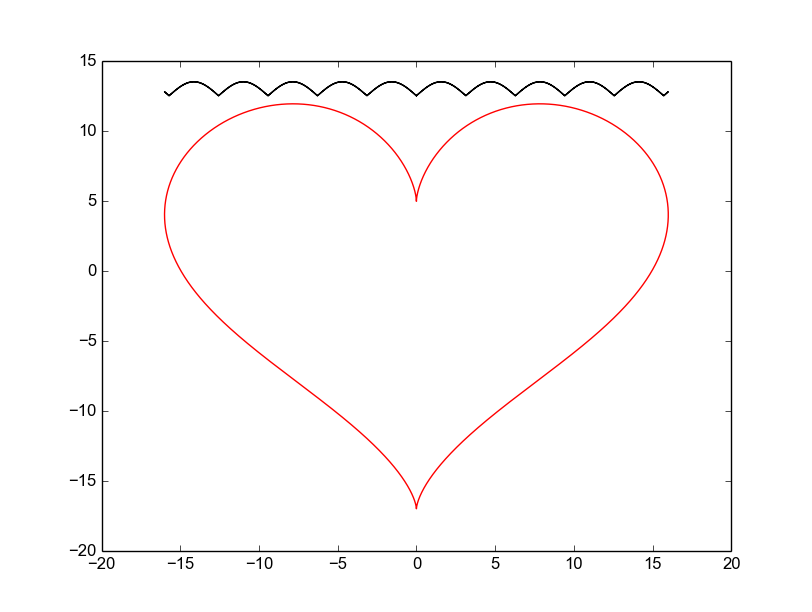
Modern example:
 1
 2
 3
 4
 5
 6
 7
 8
 9
10
11
12
13
14
15
16
17
18
19
20
21
22
23
24
25
26
27
28
29
30
|
#define _USE_MATH_DEFINES
#include <cmath>
#include "../matplotlibcpp.h"

using namespace std;
namespace plt = matplotlibcpp;

int main()
{
	// plot(y) - the x-coordinates are implicitly set to [0,1,...,n)
	//plt::plot({1,2,3,4});

	// Prepare data for parametric plot.
	int n = 5000; // number of data points
	vector<double> x(n),y(n);
	for(int i=0; i<n; ++i) {
		double t = 2*M_PI*i/n;
		x.at(i) = 16*sin(t)*sin(t)*sin(t);
		y.at(i) = 13*cos(t) - 5*cos(2*t) - 2*cos(3*t) - cos(4*t);
	}

	// plot() takes an arbitrary number of (x,y,format)-triples.
	// x must be iterable (that is, anything providing begin(x) and end(x)),
	// y must either be callable (providing operator() const) or iterable.
	plt::plot(x, y, "r-", x, [](double d) { return 12.5+abs(sin(d)); }, "k-");


	// show plots
	plt::show();
}
|
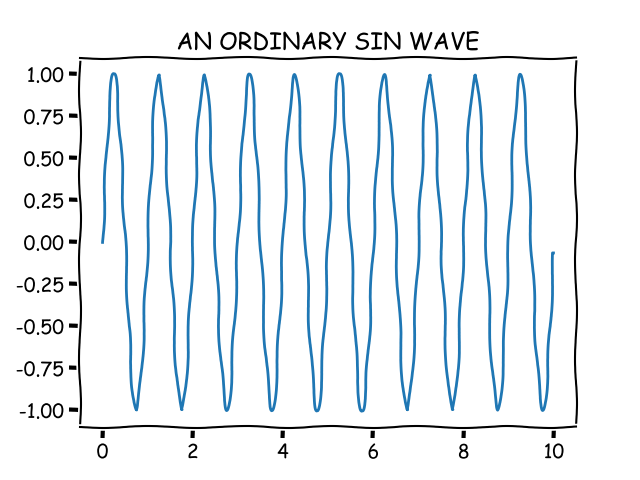
Xkcd example:
 1
 2
 3
 4
 5
 6
 7
 8
 9
10
11
12
13
14
15
16
17
18
19
20
21
|
#define _USE_MATH_DEFINES
#include <cmath>
#include "../matplotlibcpp.h"
#include <vector>

namespace plt = matplotlibcpp;

int main() {
    std::vector<double> t(1000);
    std::vector<double> x(t.size());

    for(size_t i = 0; i < t.size(); i++) {
        t[i] = i / 100.0;
        x[i] = sin(2.0 * M_PI * 1.0 * t[i]);
    }

    plt::xkcd();
    plt::plot(t, x);
    plt::title("AN ORDINARY SIN WAVE");
    plt::show();
}
|
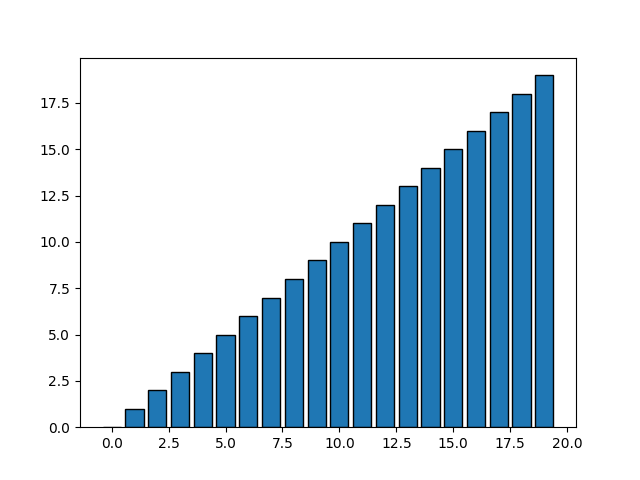
Bar example:
 1
 2
 3
 4
 5
 6
 7
 8
 9
10
11
12
13
14
15
16
17
18
|
#define _USE_MATH_DEFINES

#include <iostream>
#include <string>
#include "../matplotlibcpp.h"
namespace plt = matplotlibcpp;

int main(int argc, char **argv) {
    std::vector<int> test_data;
    for (int i = 0; i < 20; i++) {
        test_data.push_back(i);
    }

    plt::bar(test_data);
    plt::show();

    return (0);
}
|
Aniation example:
 1
 2
 3
 4
 5
 6
 7
 8
 9
10
11
12
13
14
15
16
17
18
19
20
21
22
23
24
25
26
27
28
29
30
31
32
33
34
35
36
|
#define _USE_MATH_DEFINES
#include <cmath>
#include "../matplotlibcpp.h"

namespace plt = matplotlibcpp;

int main()
{
	int n = 1000;
	std::vector<double> x, y, z;

	for(int i=0; i<n; i++) {
		x.push_back(i*i);
		y.push_back(sin(2*M_PI*i/360.0));
		z.push_back(log(i));

		if (i % 10 == 0) {
			// Clear previous plot
			plt::clf();
			// Plot line from given x and y data. Color is selected automatically.
			plt::plot(x, y);
			// Plot a line whose name will show up as "log(x)" in the legend.
			plt::named_plot("log(x)", x, z);

			// Set x-axis to interval [0,1000000]
			plt::xlim(0, n*n);

			// Add graph title
			plt::title("Sample figure");
			// Enable legend.
			plt::legend();
			// Display plot continuously
			plt::pause(0.01);
		}
	}
}
|
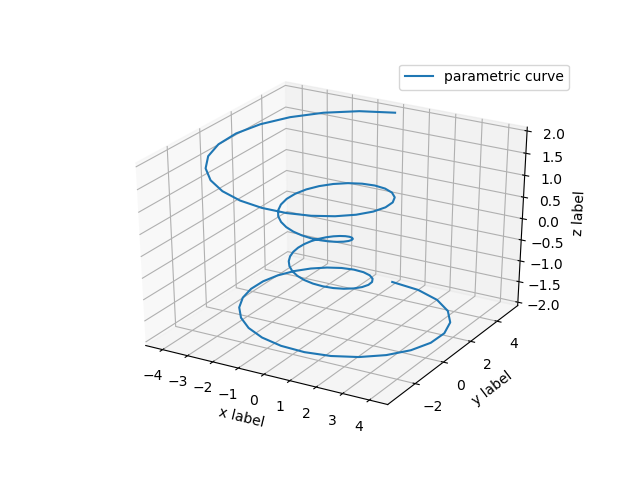
Line3d example:
 1
 2
 3
 4
 5
 6
 7
 8
 9
10
11
12
13
14
15
16
17
18
19
20
21
22
23
24
25
26
27
28
29
30
|
#include "../matplotlibcpp.h"

#include <cmath>

namespace plt = matplotlibcpp;

int main()
{
    std::vector<double> x, y, z;
    double theta, r;
    double z_inc = 4.0/99.0; double theta_inc = (8.0 * M_PI)/99.0;

    for (double i = 0; i < 100; i += 1) {
        theta = -4.0 * M_PI + theta_inc*i;
        z.push_back(-2.0 + z_inc*i);
        r = z[i]*z[i] + 1;
        x.push_back(r * sin(theta));
        y.push_back(r * cos(theta));
    }

    std::map<std::string, std::string> keywords;
    keywords.insert(std::pair<std::string, std::string>("label", "parametric curve") );

    plt::plot3(x, y, z, keywords);
    plt::xlabel("x label");
    plt::ylabel("y label");
    plt::set_zlabel("z label"); // set_zlabel rather than just zlabel, in accordance with the Axes3D method
    plt::legend();
    plt::show();
}
|
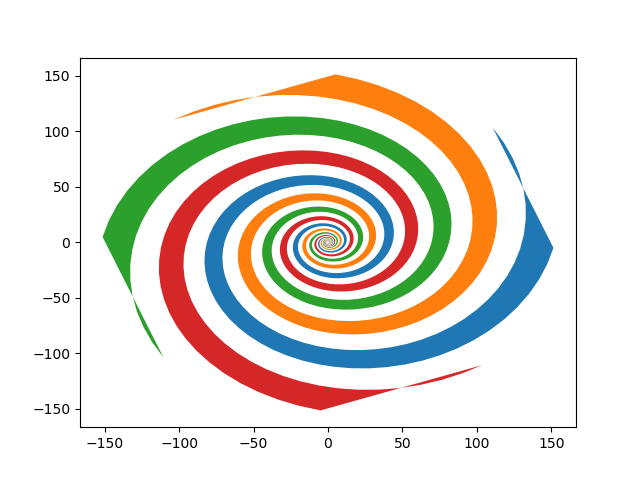
Fill example:
 1
 2
 3
 4
 5
 6
 7
 8
 9
10
11
12
13
14
15
16
17
18
19
20
21
22
23
24
25
26
27
28
29
30
31
32
33
34
35
|
#define _USE_MATH_DEFINES
#include "../matplotlibcpp.h"
#include <cmath>

using namespace std;
namespace plt = matplotlibcpp;

// Example fill plot taken from:
// https://matplotlib.org/gallery/misc/fill_spiral.html
int main() {
    // Prepare data.
    vector<double> theta;
    for (double d = 0; d < 8 * M_PI; d += 0.1)
        theta.push_back(d);

    const int a = 1;
    const double b = 0.2;

    for (double dt = 0; dt < 2 * M_PI; dt += M_PI/2.0) {
        vector<double> x1, y1, x2, y2;
        for (double th : theta) {
            x1.push_back( a*cos(th + dt) * exp(b*th) );
            y1.push_back( a*sin(th + dt) * exp(b*th) );

            x2.push_back( a*cos(th + dt + M_PI/4.0) * exp(b*th) );
            y2.push_back( a*sin(th + dt + M_PI/4.0) * exp(b*th) );
        }

        x1.insert(x1.end(), x2.rbegin(), x2.rend());
        y1.insert(y1.end(), y2.rbegin(), y2.rend());

        plt::fill(x1, y1, {});
    }
    plt::show();
}
|
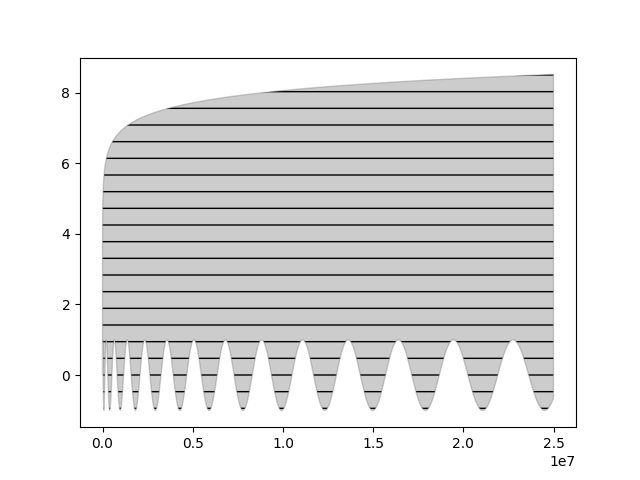
Fill-inbetween example:
 1
 2
 3
 4
 5
 6
 7
 8
 9
10
11
12
13
14
15
16
17
18
19
20
21
22
23
24
25
26
27
28
|
#define _USE_MATH_DEFINES
#include "../matplotlibcpp.h"
#include <cmath>
#include <iostream>

using namespace std;
namespace plt = matplotlibcpp;

int main() {
  // Prepare data.
  int n = 5000;
  std::vector<double> x(n), y(n), z(n), w(n, 2);
  for (int i = 0; i < n; ++i) {
    x.at(i) = i * i;
    y.at(i) = sin(2 * M_PI * i / 360.0);
    z.at(i) = log(i);
  }

  // Prepare keywords to pass to PolyCollection. See
  // https://matplotlib.org/api/_as_gen/matplotlib.axes.Axes.fill_between.html
  std::map<string, string> keywords;
  keywords["alpha"] = "0.4";
  keywords["color"] = "grey";
  keywords["hatch"] = "-";

  plt::fill_between(x, y, z, keywords);
  plt::show();
}
|
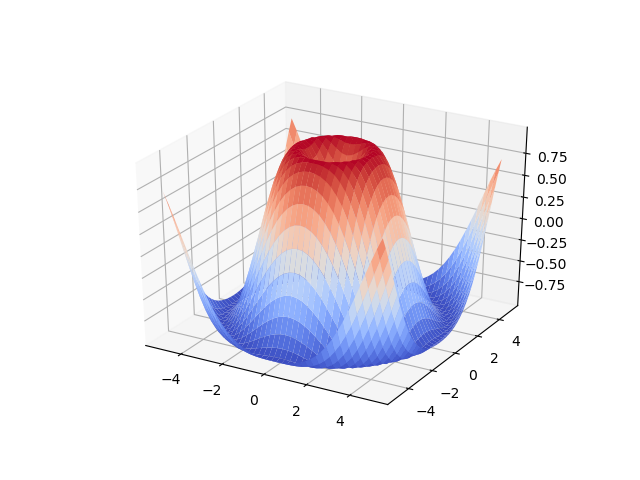
Surface example:
 1
 2
 3
 4
 5
 6
 7
 8
 9
10
11
12
13
14
15
16
17
18
19
20
21
22
23
24
|
#include "../matplotlibcpp.h"

#include <cmath>

namespace plt = matplotlibcpp;

int main()
{
    std::vector<std::vector<double>> x, y, z;
    for (double i = -5; i <= 5;  i += 0.25) {
        std::vector<double> x_row, y_row, z_row;
        for (double j = -5; j <= 5; j += 0.25) {
            x_row.push_back(i);
            y_row.push_back(j);
            z_row.push_back(::std::sin(::std::hypot(i, j)));
        }
        x.push_back(x_row);
        y.push_back(y_row);
        z.push_back(z_row);
    }

    plt::plot_surface(x, y, z);
    plt::show();
}
|
系列文章
c++调用matplotlib(二)
c++调用matplotlib(三)
c++调用matplotlib(四)
Reference
【1】matplotlib-cpp
本文由芒果浩明发布,转载请注明出处。
本文链接:https://blog.mangoeffect.net/cpp/call-matplotlib-on-cpp.html